Posts

Showing posts with the label Vancouver

Richmond Real Estate Market
Image
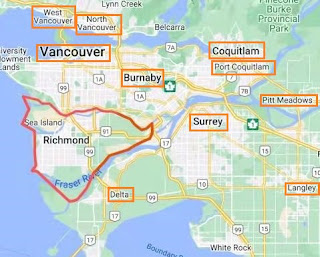
Richmond is an island city. It is made up of a number islands in the Fraser River delta. It is just one meter above sea level. It was prone to flooding, especially during high tide. Therefore, major islands are now surrounded by a system of dykes, which serve to protect the town. Also, since it occupies land in a river delta, the city has plenty of rich soil for agriculture. Richmond is a culturally unique community. As of 2021, the city has an estimated population of 209,937 people with 60 percent being immigrants, the highest proportion of immigrants in Canada. Majority of immigrants are Chinese. Richmond has been experiencing growth and change, transforming from a rural, local community to an international city with a balance of urban, suburban family and rural areas. The city is 20 minutes from downtown Vancouver and 25 minutes from US border. It’s the location of Vancouver’s international airport.  The SkyTrain, Canada Line, speeds up transit system and connects Richmond to other

Living in Gastown

Image
Gastown has been designated a national historic site. It is in the downtown Vancouver east side,  adjacent to downtown Vancouver . You’ll see the old town of Vancouver with heritage brick buildings and historic character, Gastown is mix of contemporary fashion boutiques, tourist businesses, good gift shop for souvenirs, fine restaurants, bars, cafés, newly upscale housing and etc. The world-famous steam clock is in Gastown.  Also, waterfront station is steps away to Gastown. It’s Vancouver’s main transportation terminal from where you can catch the SkyTrain to almost anywhere or take SeaBus across Burrard Inlet to North Vancouver.  With everything Gastown provides, living in Gastown would be a great advantage. Now there is a very nice one bedroom and den apartment going on the market. It’s located at 55 Alexander Street, the most desirable street in Historic Gastown. The suite is in a winning heritage style building with great view of the harbour, mountains and downtown. Excellent int

Vancouver Real Estate Market

Image
  Vancouver is a major city in Western Canada with population of 662,248, based on the 2021 census. It has the highest population density in Canada. It is one of the most ethnically and linguistically diverse cities in Canada. According to the 2016 census, only 48.2% of its residents are European. The total visible minority population is 51.6%, of which Chinese is the largest one at 27%.  Vancouver is one of the most livable cities in Canada and in the world. Also, it is one of the most expensive cities in Canada and in the world. The table below are the benchmark price change in three categories: apartments, townhouses and detached properties. All three categories have had a significant increase in past 10 years: apartments 95%, townhouses 98% and detached properties 94%.  Making them more visible, let’s take a look trend of the market. See the figures below: Benchmark Price in Detached Properties Benchmark Price in Townhouses Benchmark Price in Apartments From these graphics, we can

Condominium Market in Vancouver West, BC

Image
  We discussed condominium market in Vancouver East . Now let’s look at the situation in Vancouver West. Generally, all markets in west side of Vancouver are higher than east side.   The figure below is condominium benchmark price trend in Vancouver, Vancouver West and Vancouver East since 2005. The price in Vancouver West is much higher. The benchmark price and percentage change in each sub-area in Jan.2022 are listed below. The yellow marks are the highest percentage change, while blue ones are the lowest change. You will notice market in Coal Harbour has been low performance in past 5 years. South Granville has increased strongly in past 10 years. Downtown Vancouver got the highest increase in Jan.2022. However, Kitsilano has the biggest percentage decrease in Jan.2022.  If you would like to take a look sub-area map, click here .  For more market in Vancouver, please click here or contact me at awang@macrealty.com

Condominium Market in Vancouver East, BC

Image
  The figure below represents condominium market  by MLS HPI Price in Vancouver, Vancouver West  and Vancouver East. Vancouver East is lower than  Vancouver West. Now we break down Vancouver  East to sub-areas and take a look how each sub- area does in the market. The table below lists MLS  HPI prices in each sub-area. The listing is in  decreasing benchmark price order. The table above shows the different areas, with the benchmark price, and the percentage change in value over 1 month, and 1, 5, and 10 years. You will notice that the percentage price change for one month is not consistent. Some areas show an increase (Victoria at 1.3%), while others show a decrease (Knight at -2.37%). However, for the 1, 5, and 10 year time frame, the benchmark prices have all gone up, some quite a bit. As an example, over 1 year, South Vancouver benchmark price increased by 22.45%. Over 5 years, Victoria benchmark price increased 51.69%. Over 10 years, Hastings benchmark price went up 154%. If you w