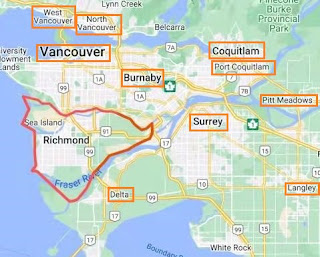
Richmond Real Estate Market


The figure below represents condominium market
by MLS HPI Price in Vancouver, Vancouver West
and Vancouver East. Vancouver East is lower than
Vancouver West. Now we break down Vancouver
East to sub-areas and take a look how each sub-
area does in the market. The table below lists MLS
HPI prices in each sub-area. The listing is in
decreasing benchmark price order.
The table above shows the different areas, with the
benchmark price, and the percentage change in value over 1 month, and 1, 5, and
10 years. You will notice that the percentage price change for one month is not
consistent. Some areas show an increase (Victoria at 1.3%), while others show a
decrease (Knight at -2.37%). However, for the 1, 5, and 10 year time frame, the
benchmark prices have all gone up, some quite a bit. As an example, over 1 year,
South Vancouver benchmark price increased by 22.45%. Over 5 years, Victoria benchmark
price increased 51.69%. Over 10 years, Hastings benchmark price went up 154%.
If you would like to look at a map of sub-areas, click here.
For more information regarding Vancouver market, please click here or contact me at awang@macrealty.com
Comments
Post a Comment